Does better decision-making actually help?
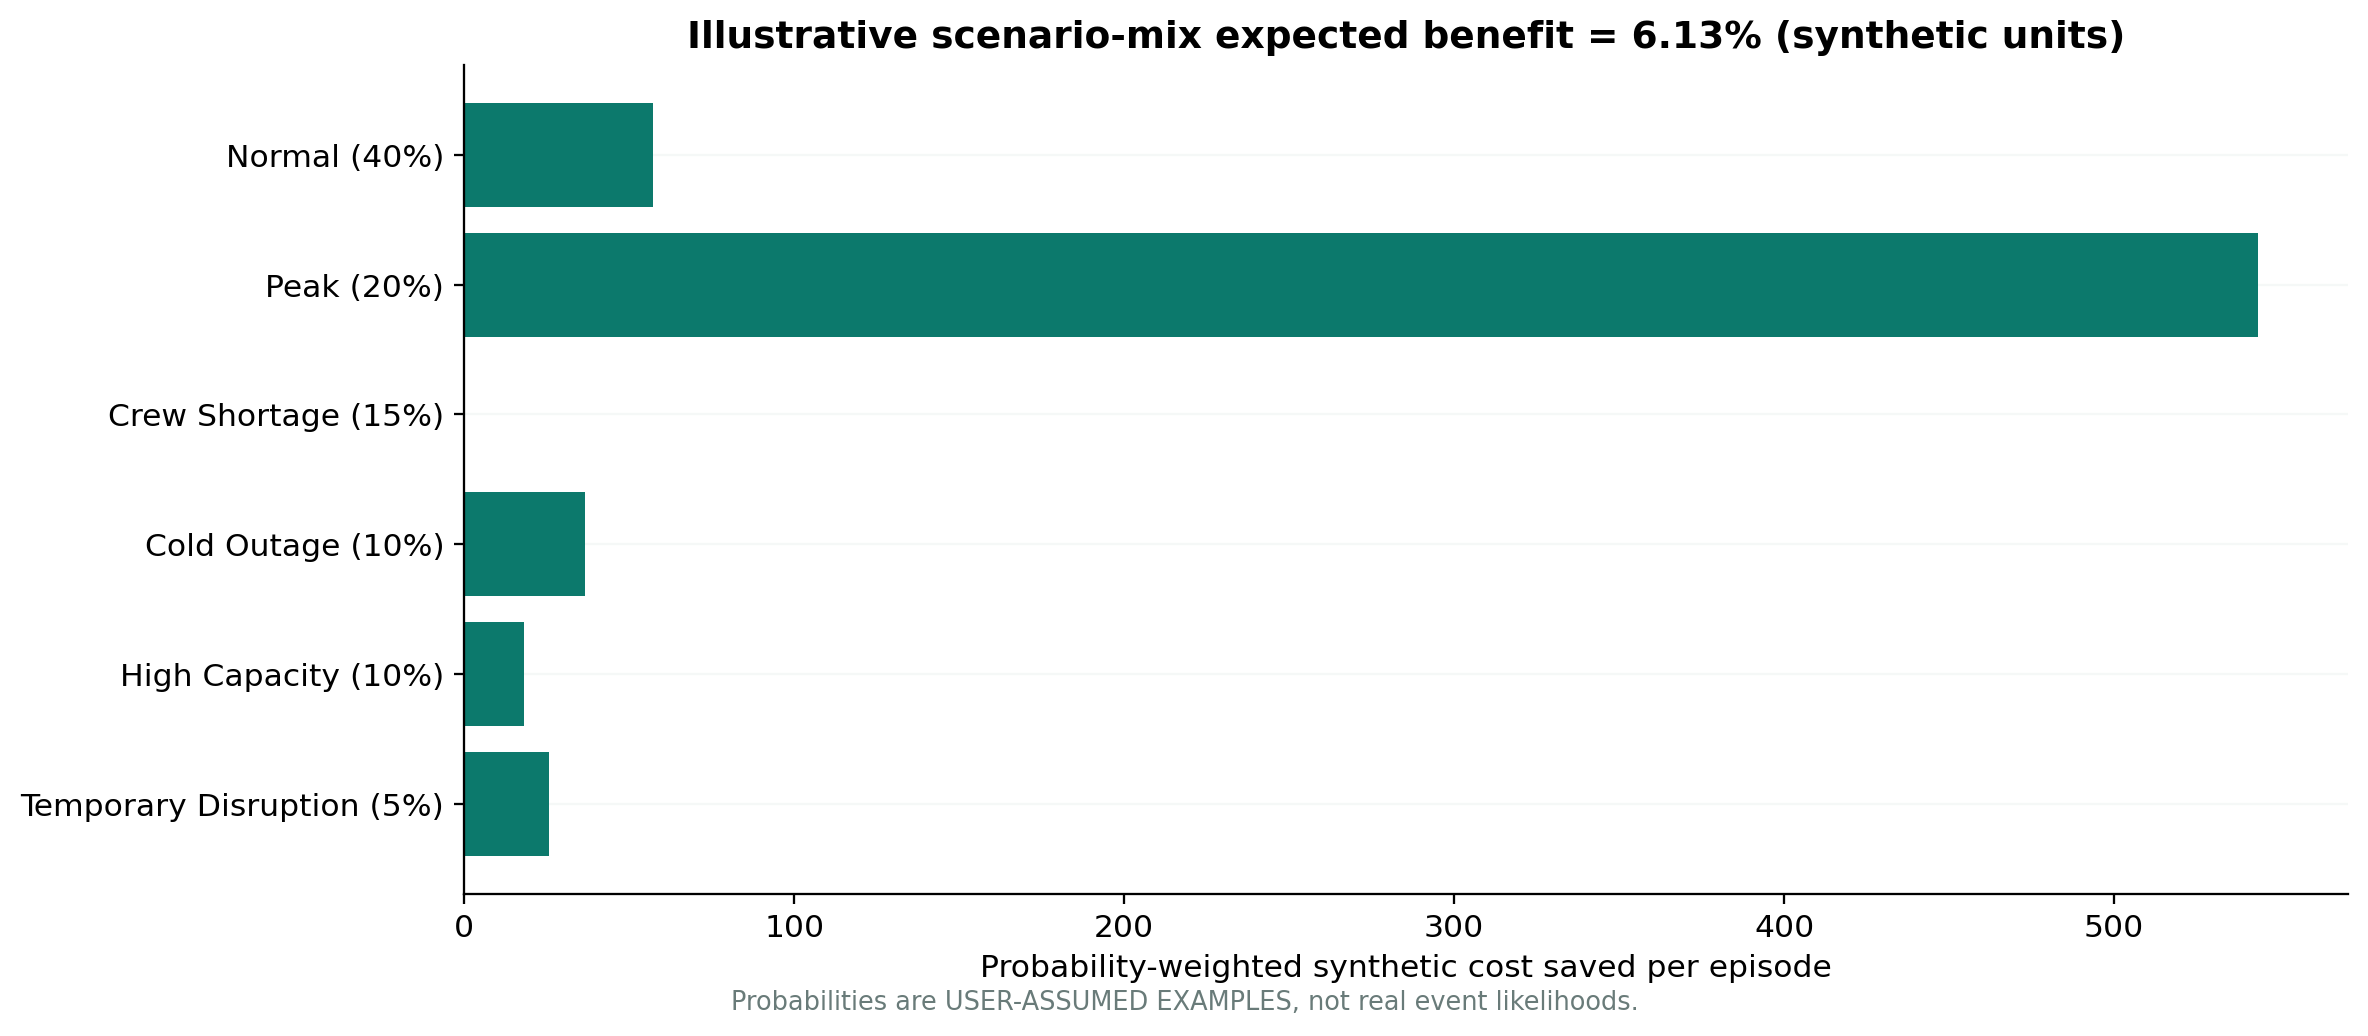
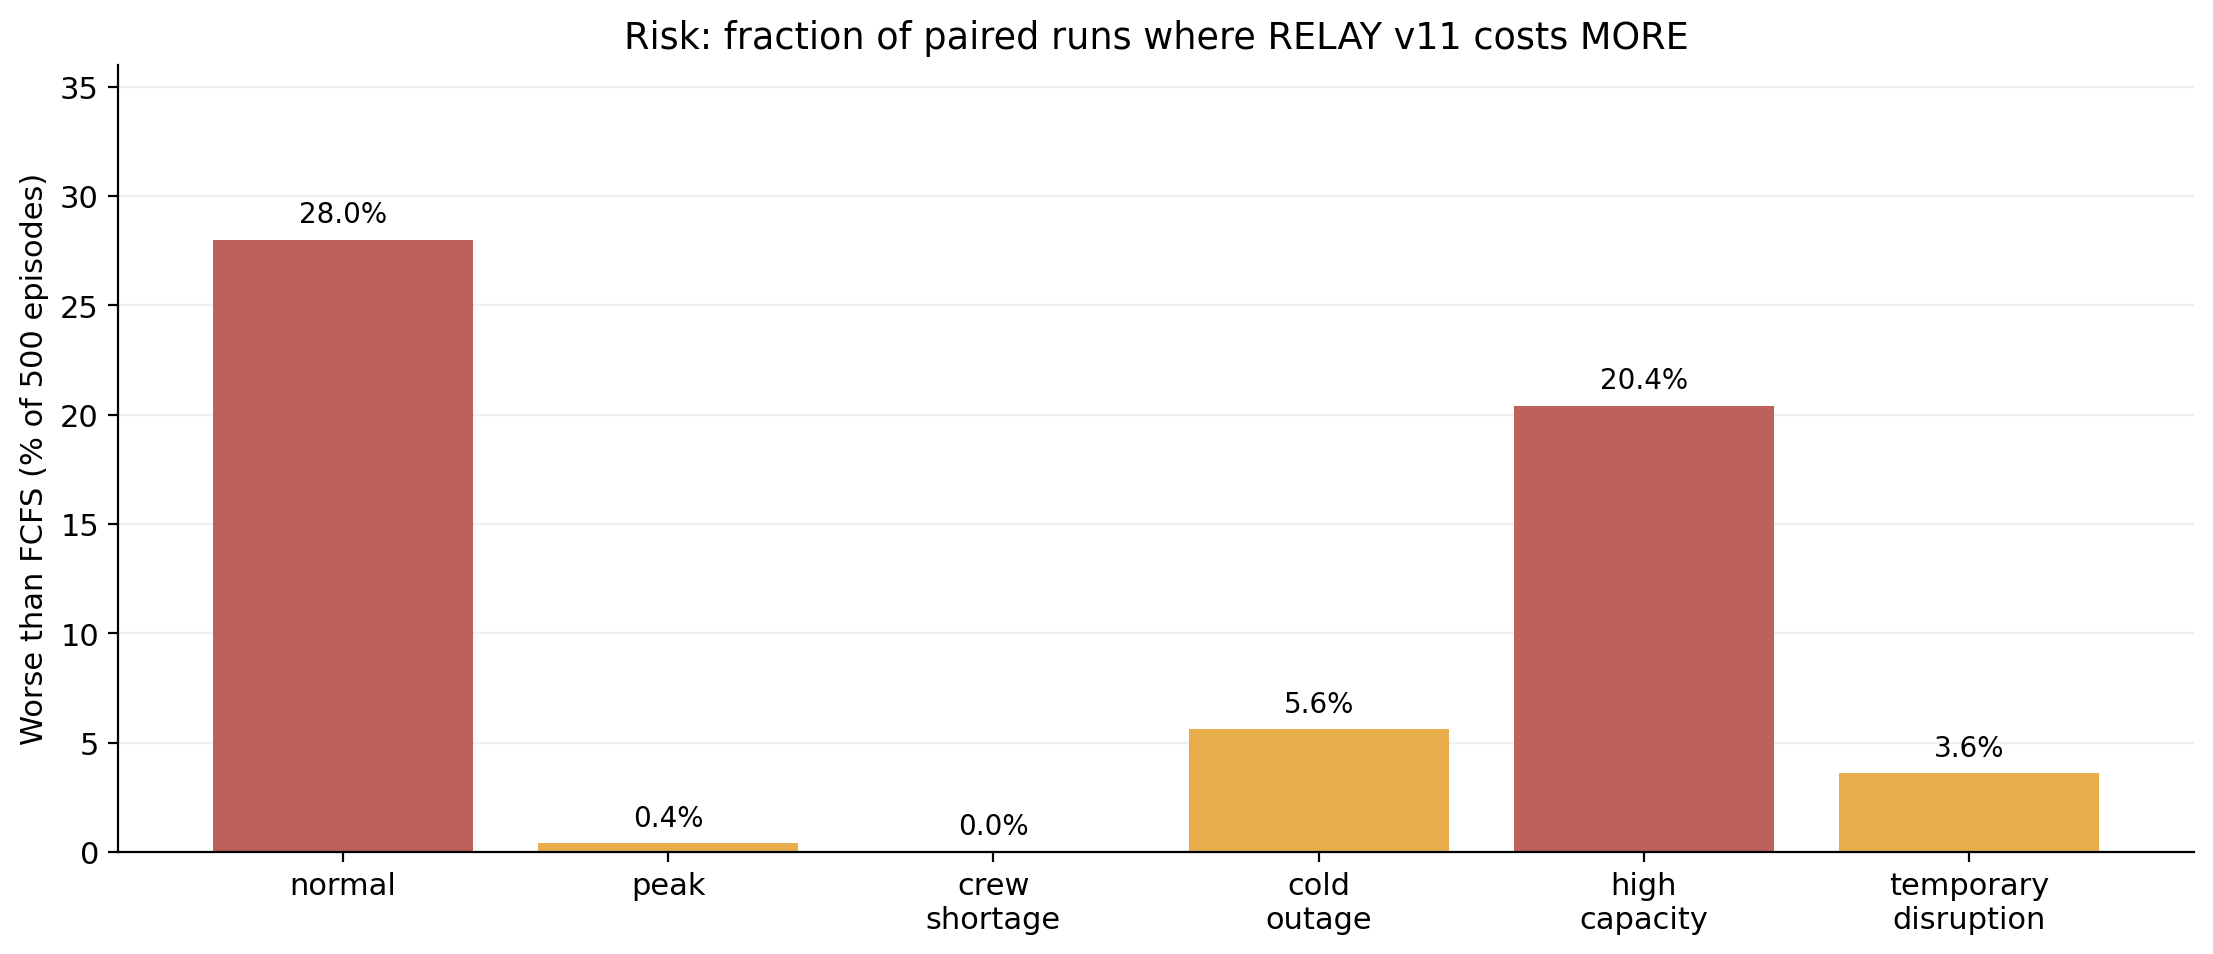
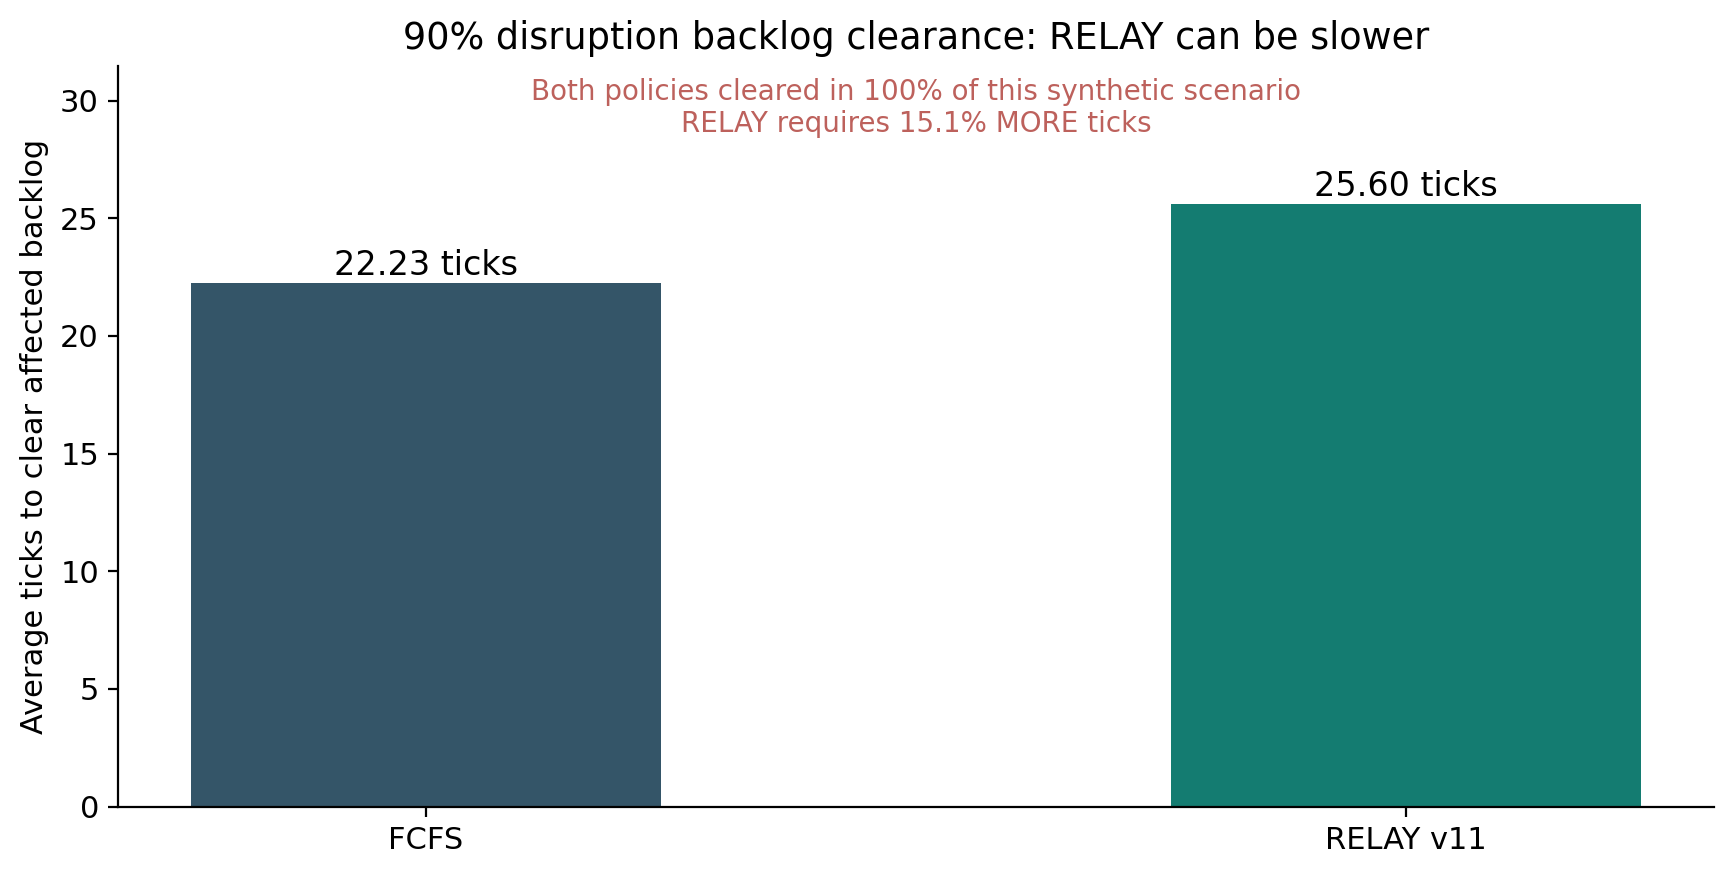
Measured on paired synthetic cargo staging episodes — not a claim of airline ROI. Costs are unitless. We disclose denominator, SLA, lead time, tail risk and cases where RELAY is worse.
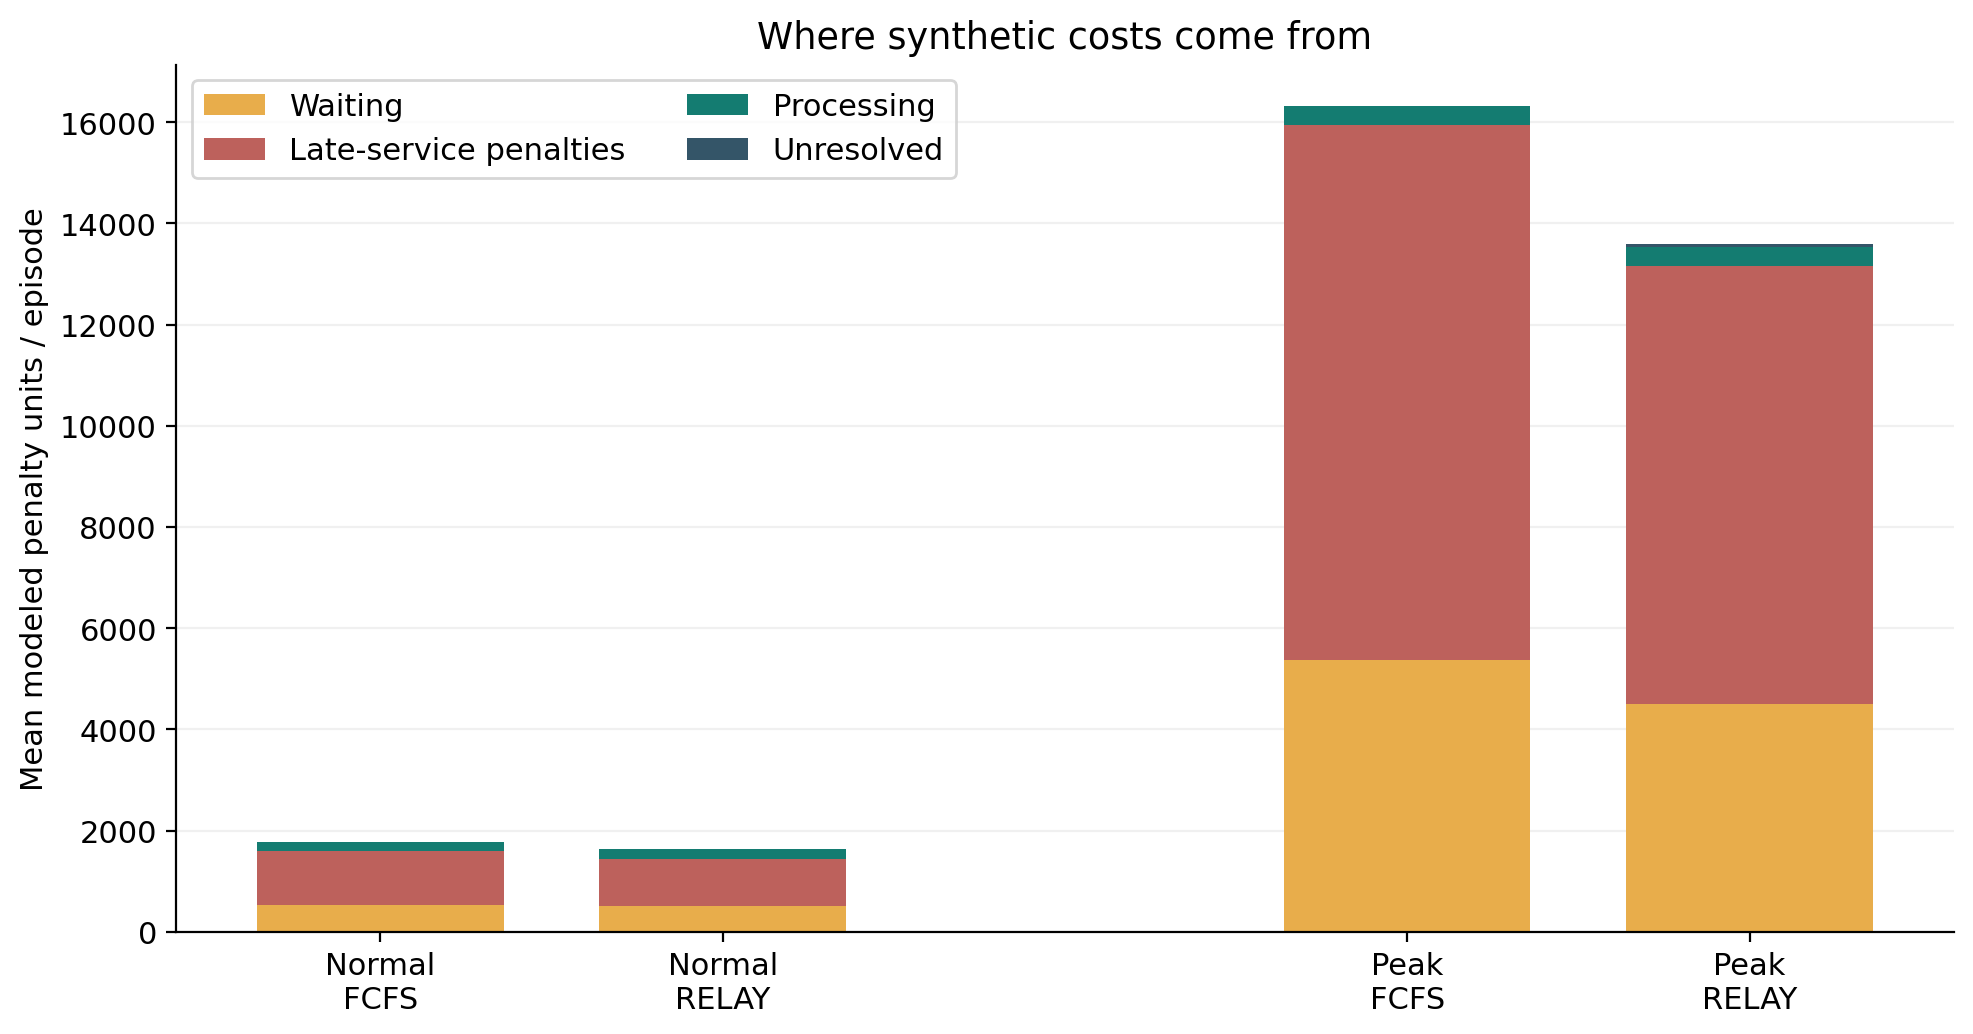
Cost reduction — same arrivals, same resources
What improved? What did not?
Loading| Scenario | Cost reduced | 95% paired CI | On-time rate Δ | Staging lead time ↓ | Tail cost ↓ | Runs worse |
|---|
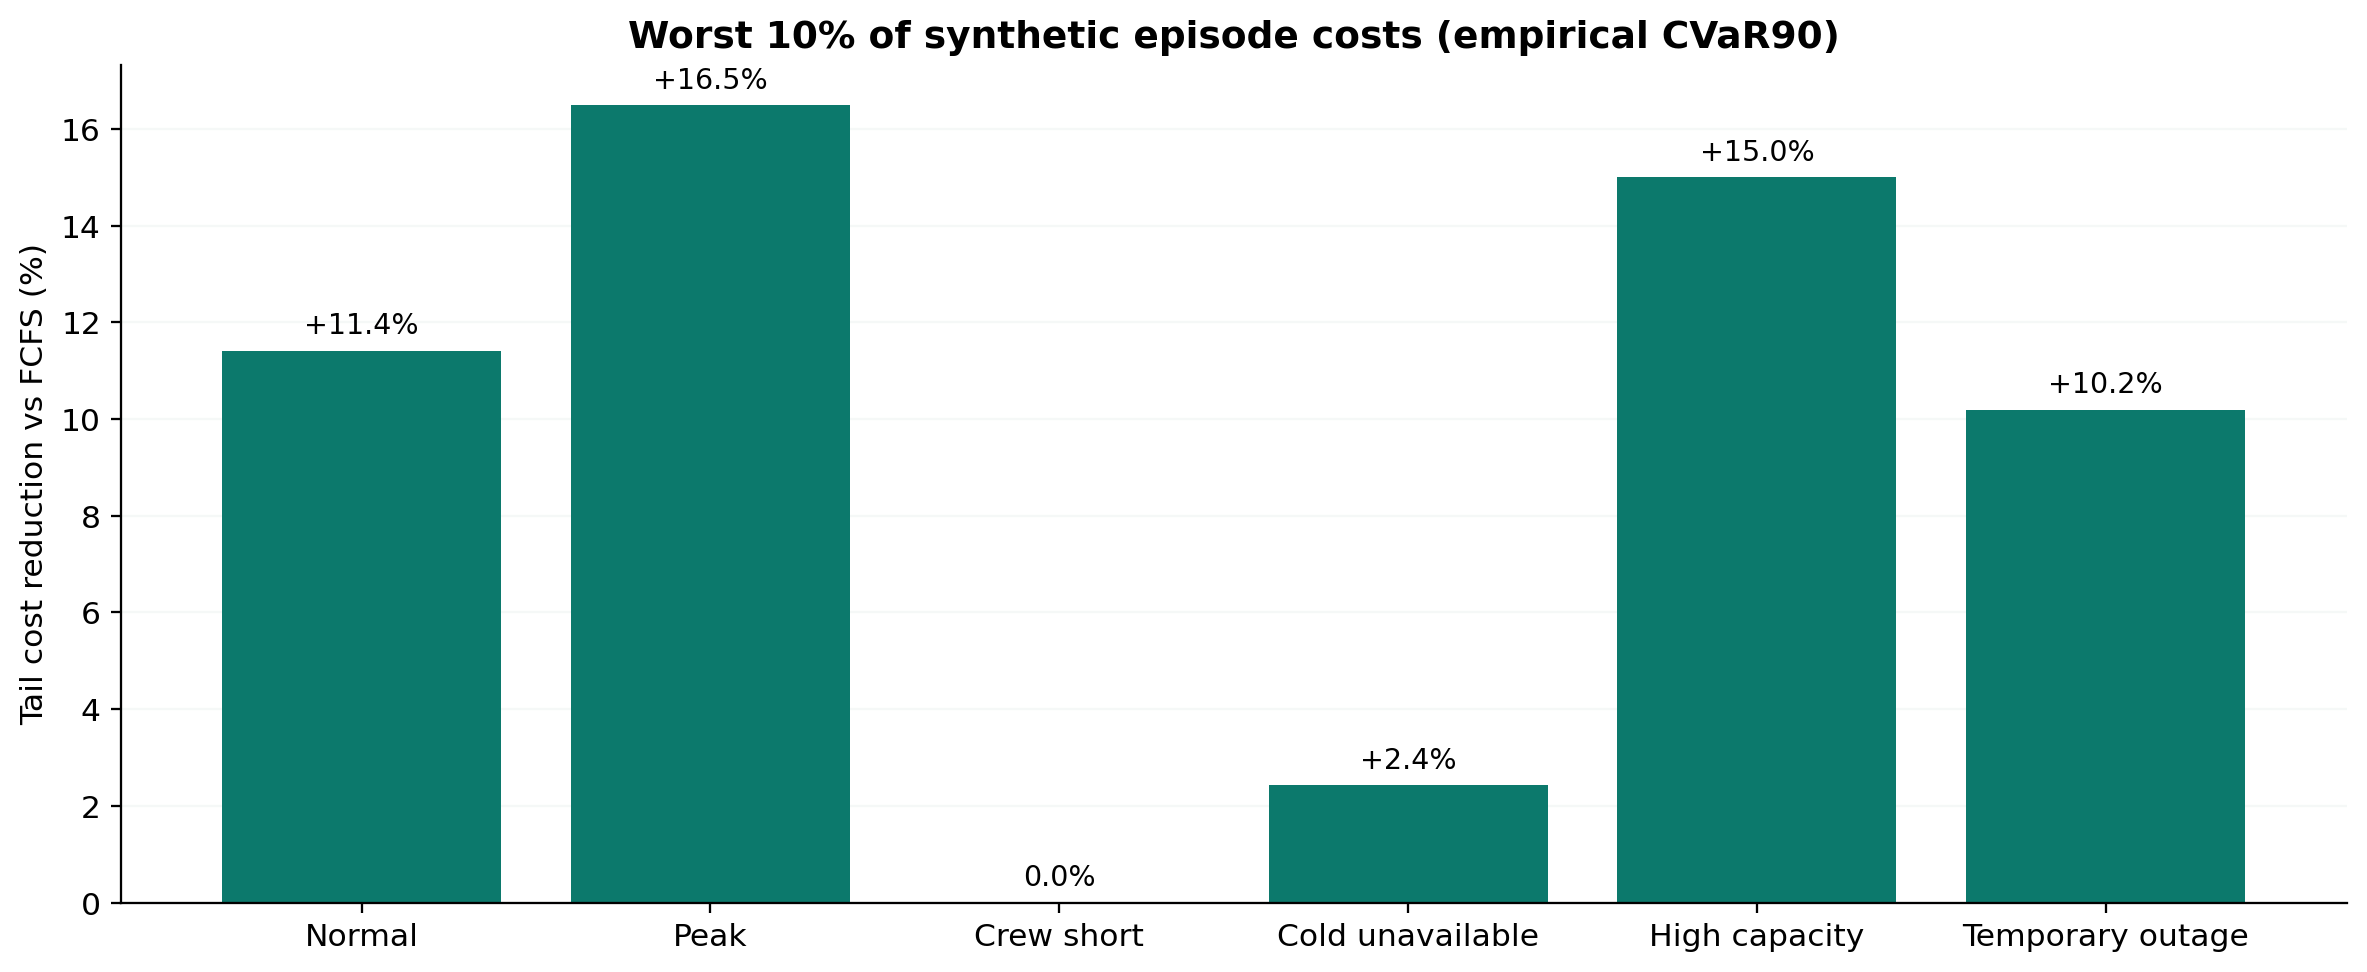
On-time Δ is percentage points, not percent cost; lead time is restricted mean staging time, NOT flight recovery or human planning time. CVaR tail cost is across episode totals.
Recompute the evidence
Pinned report is generated by the bundled Python simulator; fresh runs use an isolated lab and do not interrupt your live three-Twin clock.
Scientific integrity & deployment scope
Bounded 2D floor candidates plus separate geometric 3D preflight. No aircraft load/restraint certificate.
Exact finite one-step Bayesian verification identity. No full sequential belief-MDP or global counterfactual reoptimization.
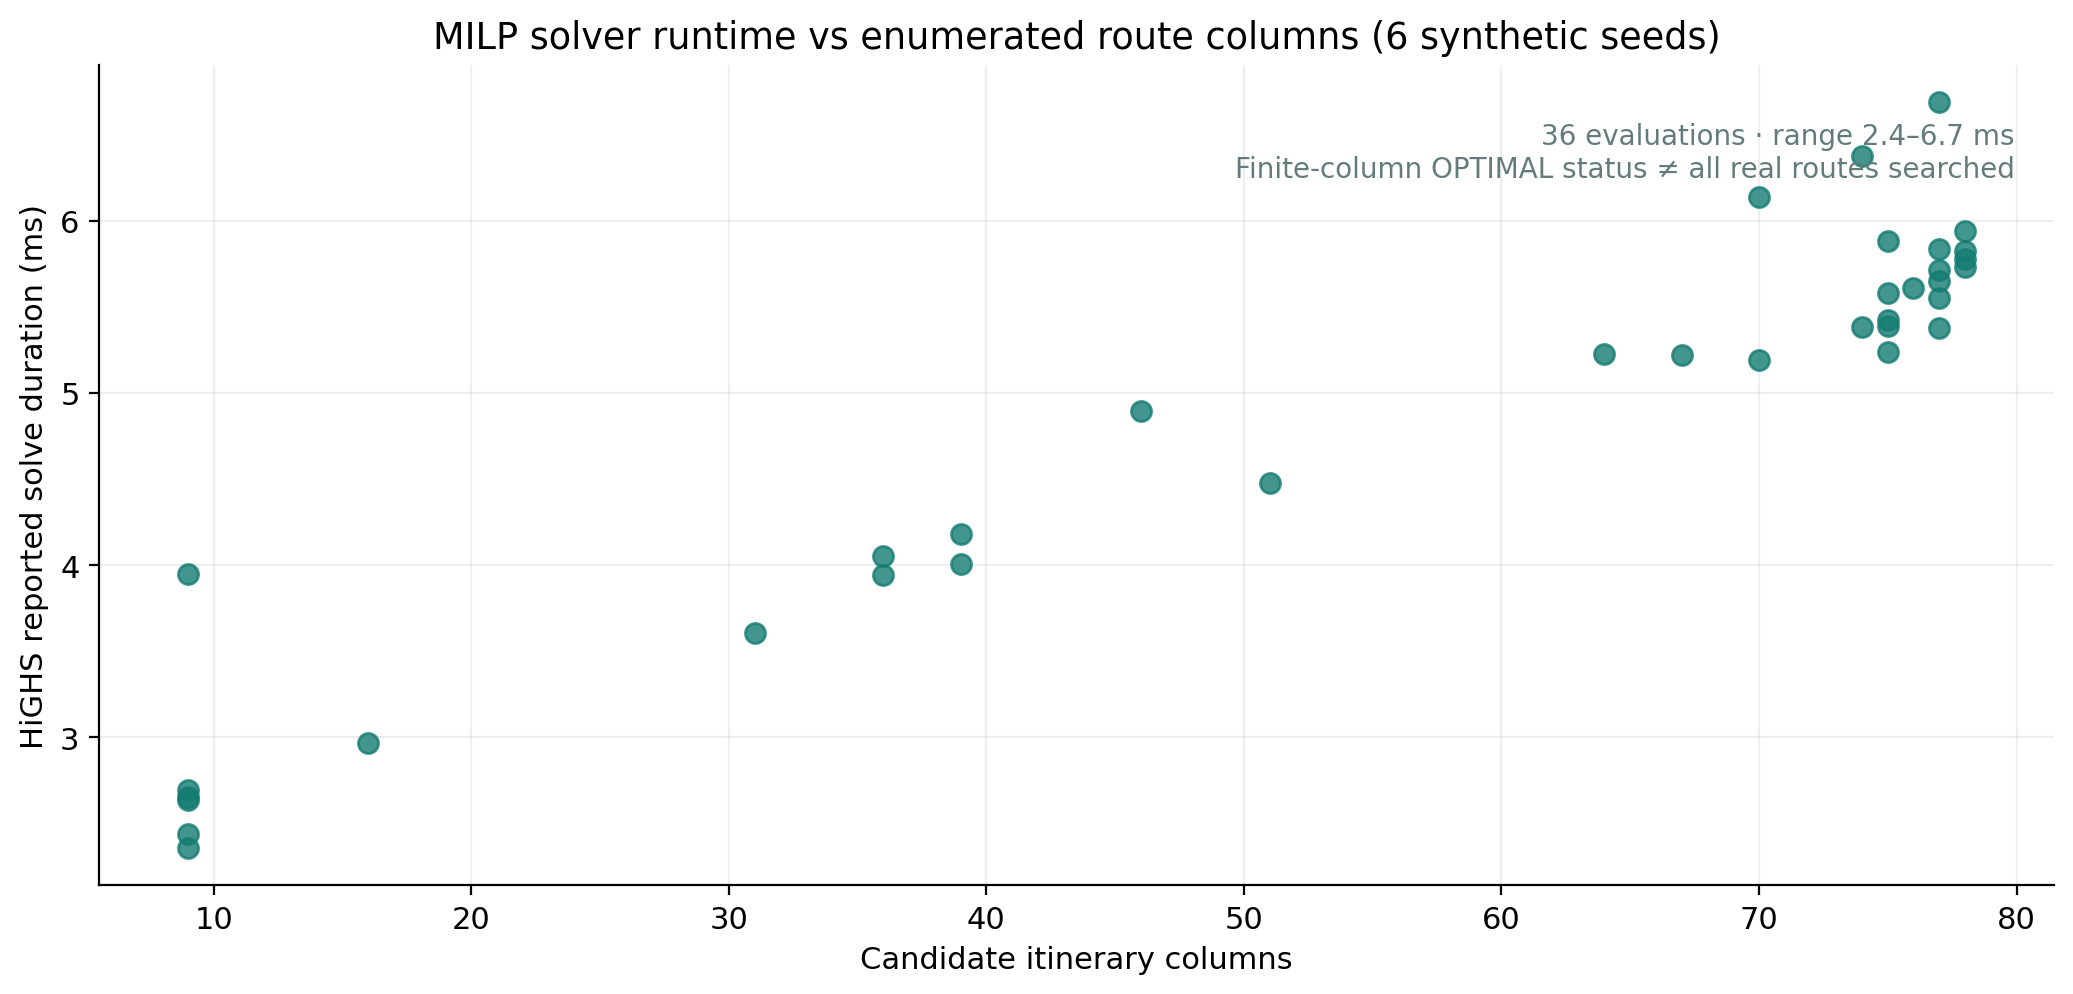
Shared-capacity HiGHS MILP on enumerated routes. Cluster mutation remains a research fixture, not live optimizer.
Live data & cross-Twin checks
Loading…
Loading…
Local-only, no airline credentials, no authorized actual capacity, no live tracking, no real customer tenancy. Do not expose on public Internet.
All detailed benchmark inputs and historical-v10 denominator comparison are available as JSON in /v11/api/kpis and /v11/api/v10-original-kpis.
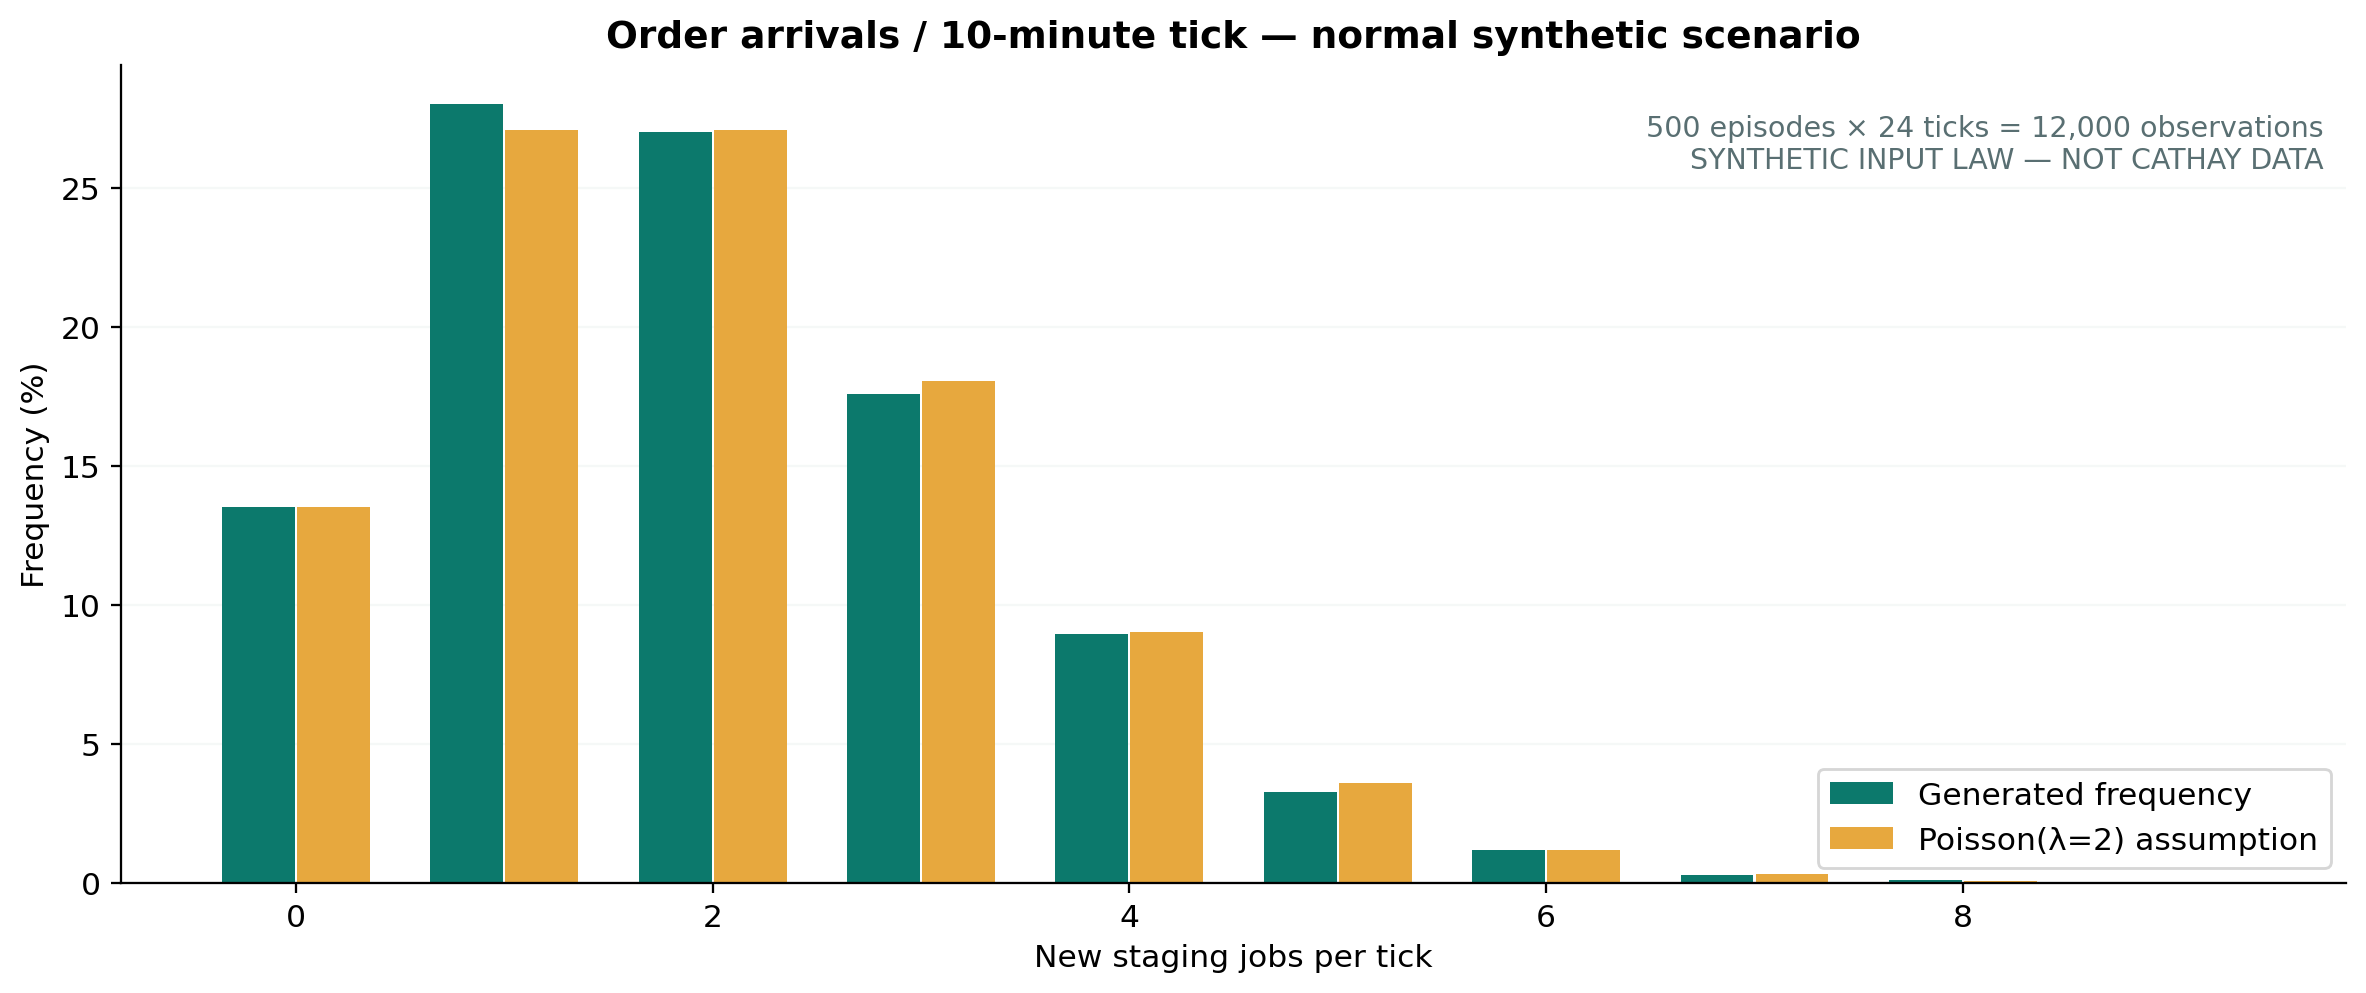
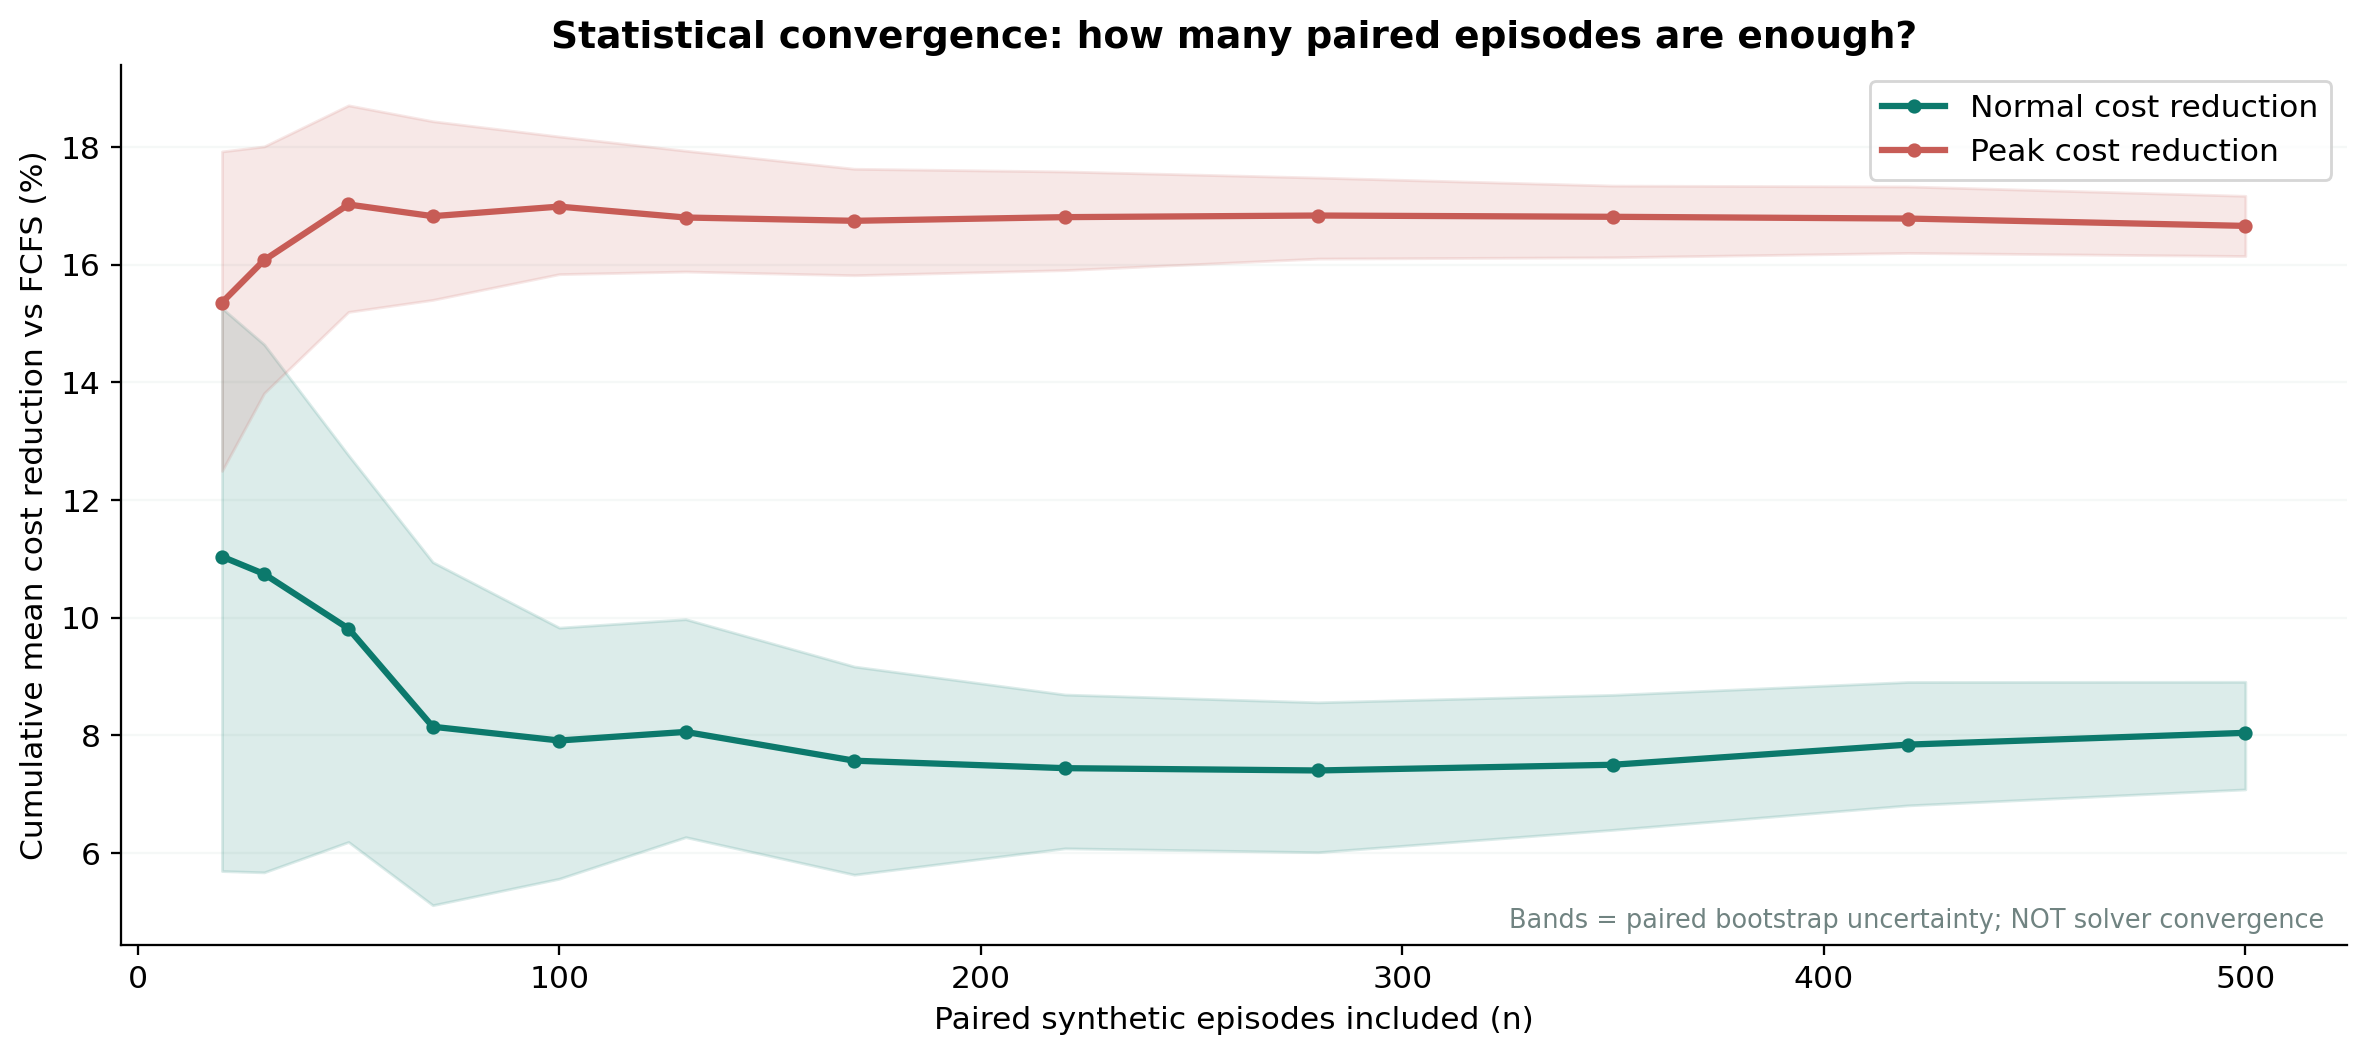
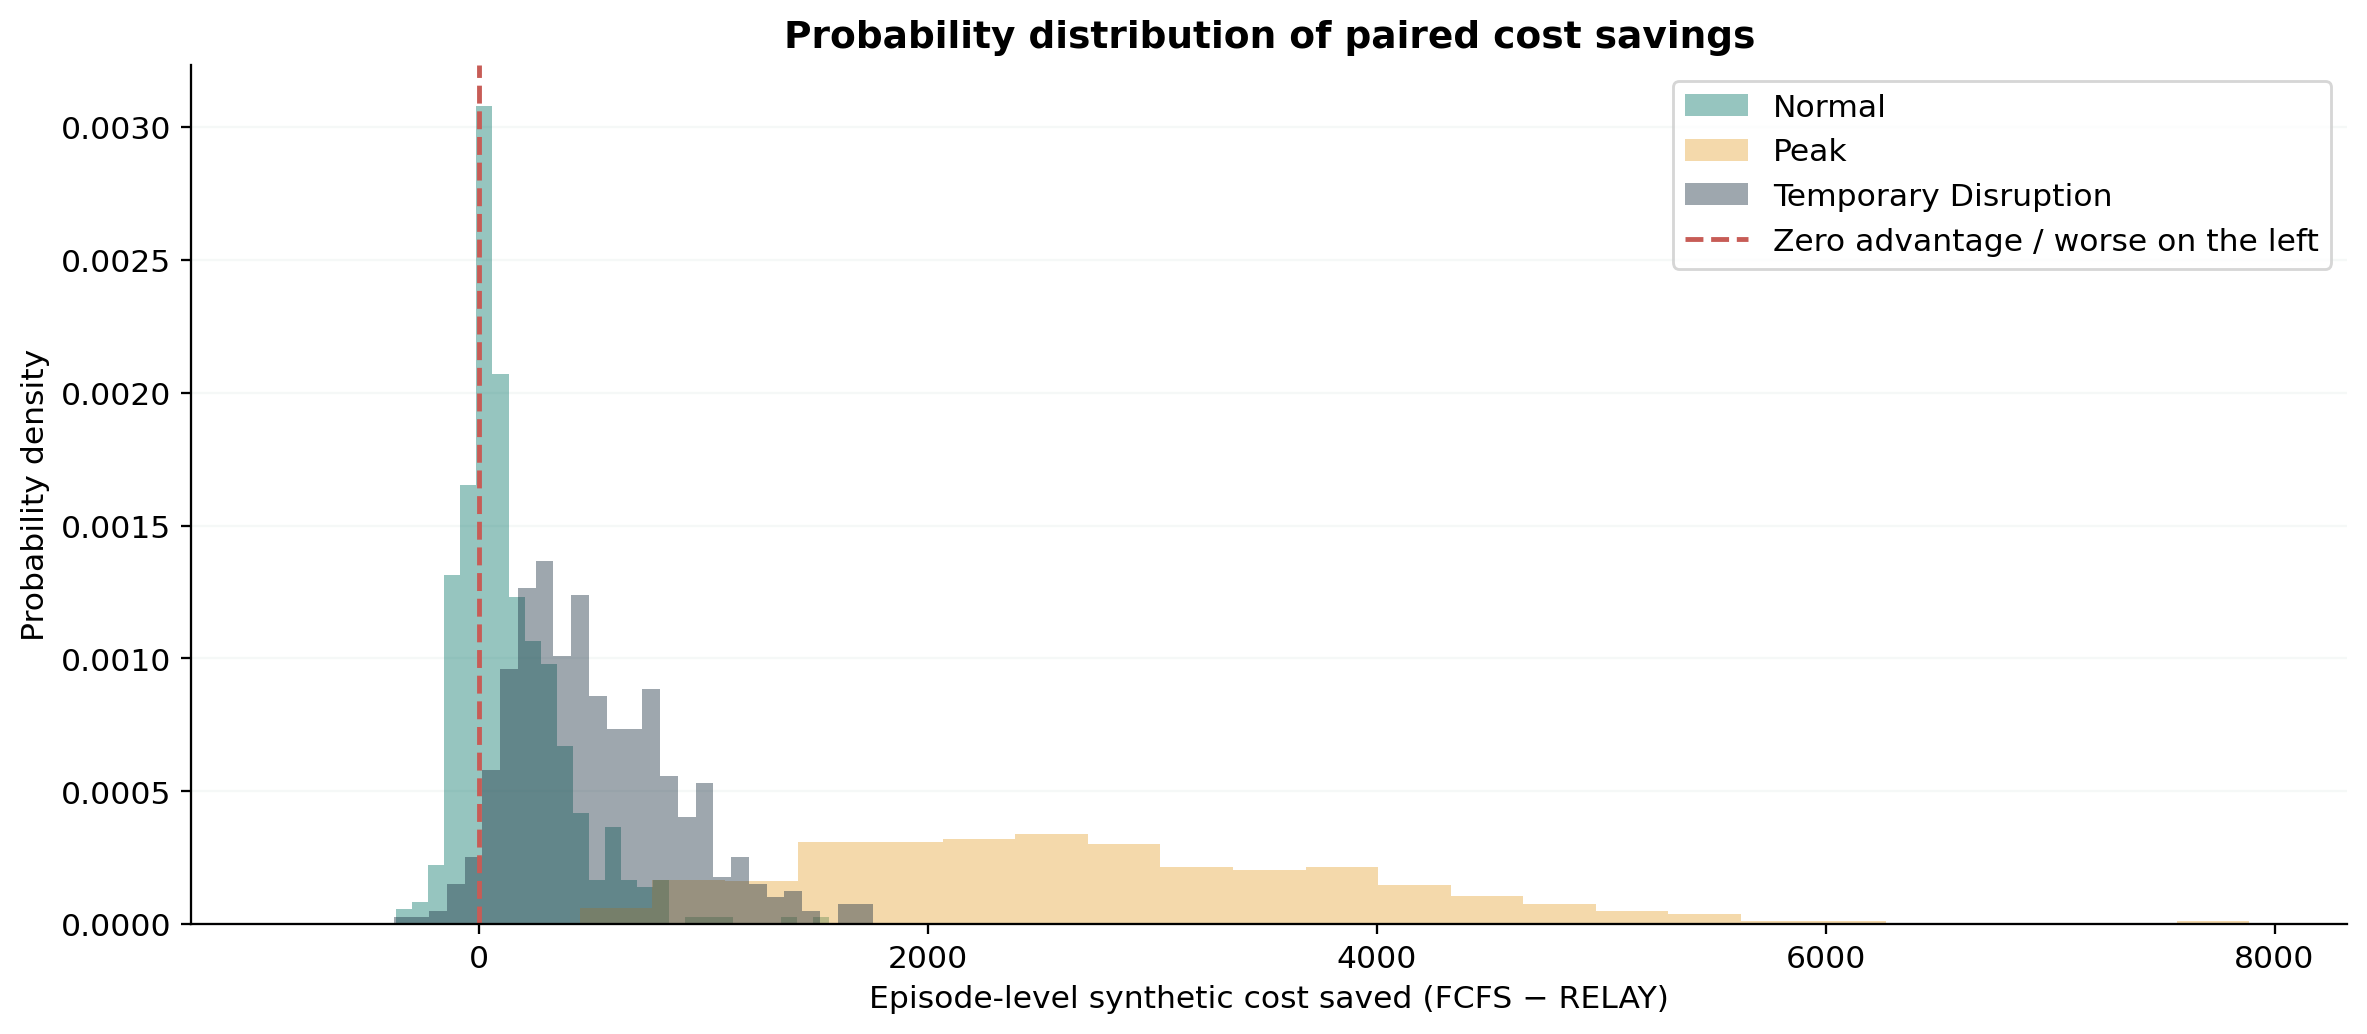
Deep evidence: frequency → convergence → risk → ROI
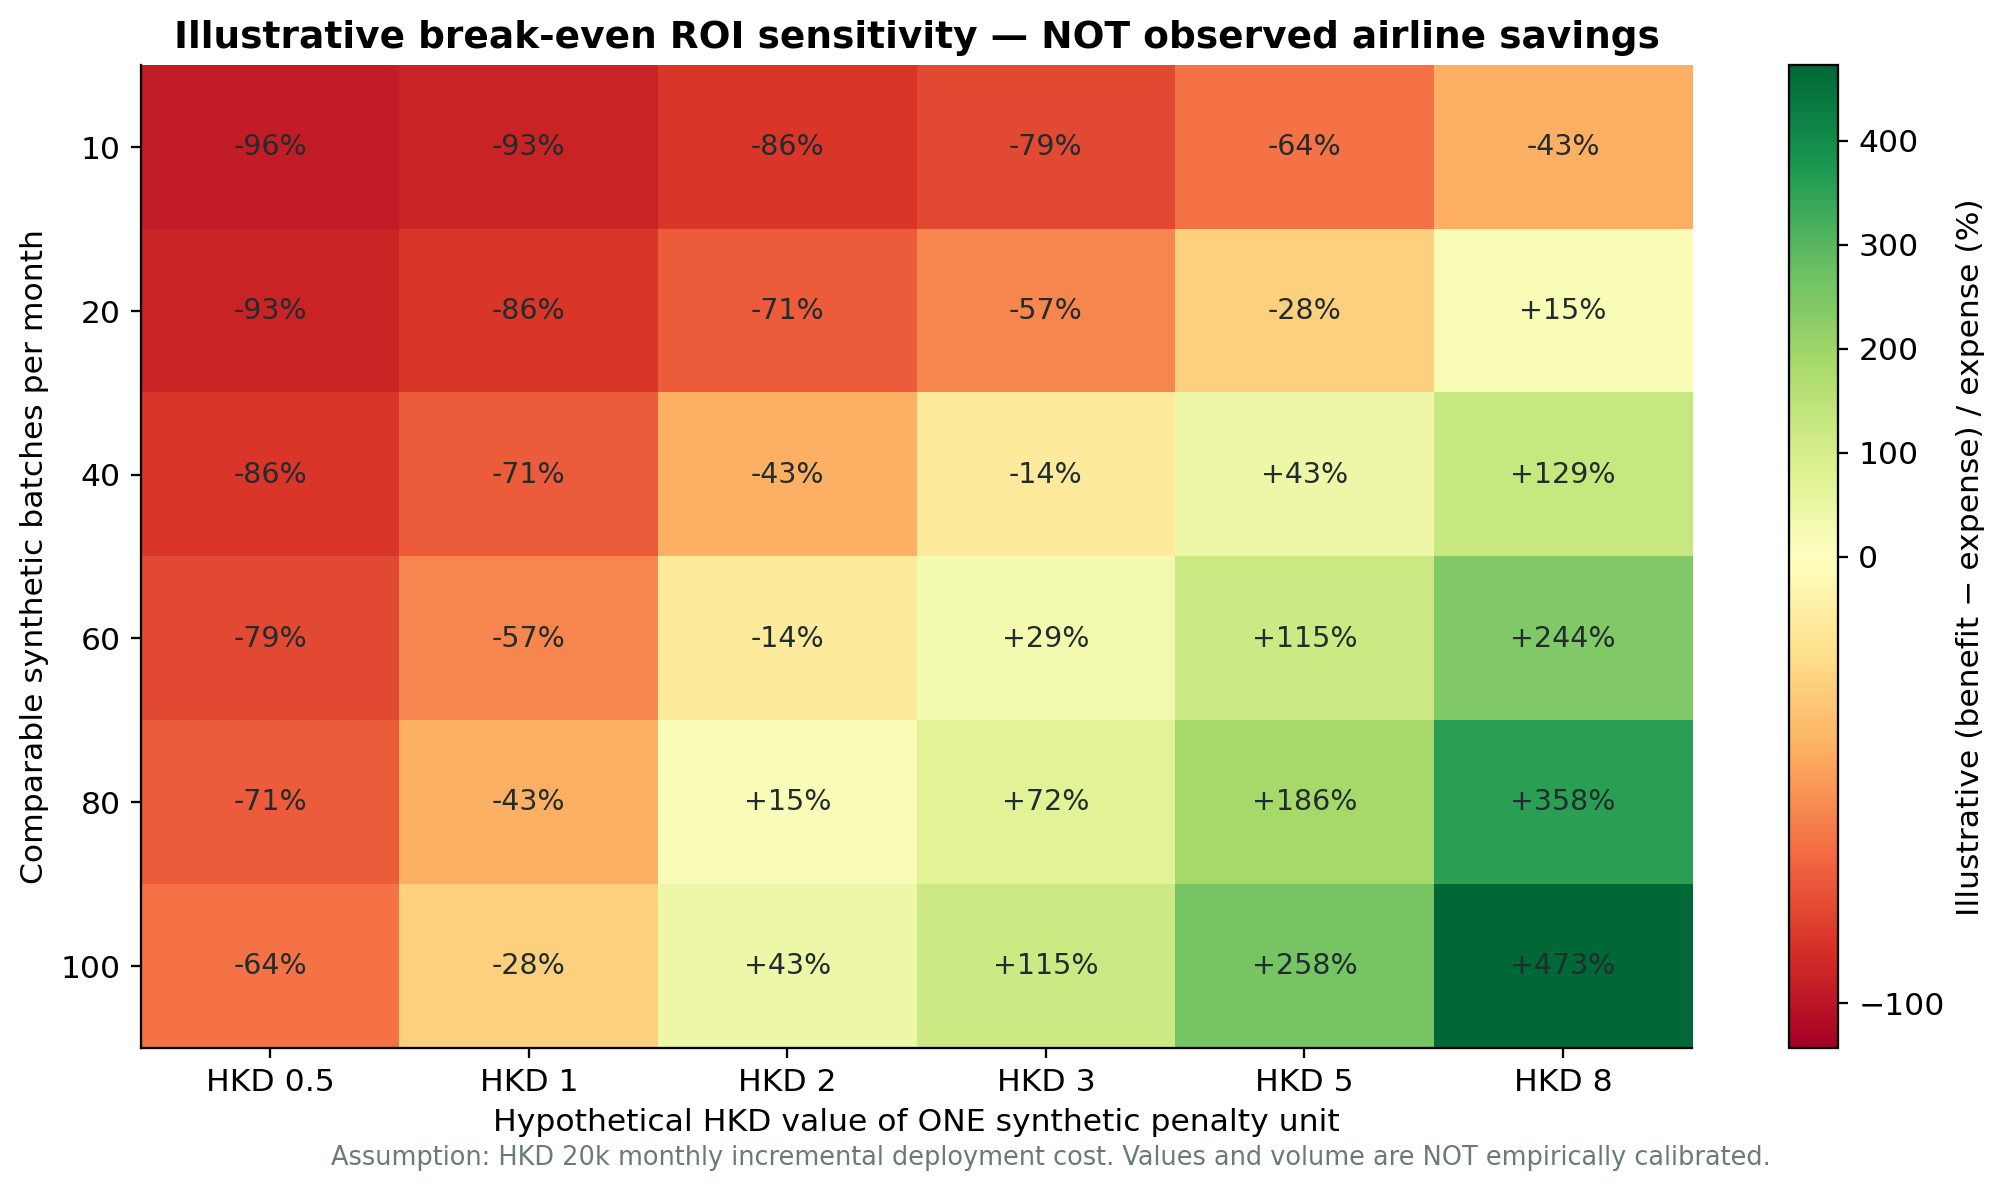
Graphs are measured or derived from the bundled reproducible synthetic episode dataset. This is NOT an airline cost study.